Test has now been restarted with the client requesting just a single route each time…
Requesting just a single route doesn’t seem to make the slightest difference…
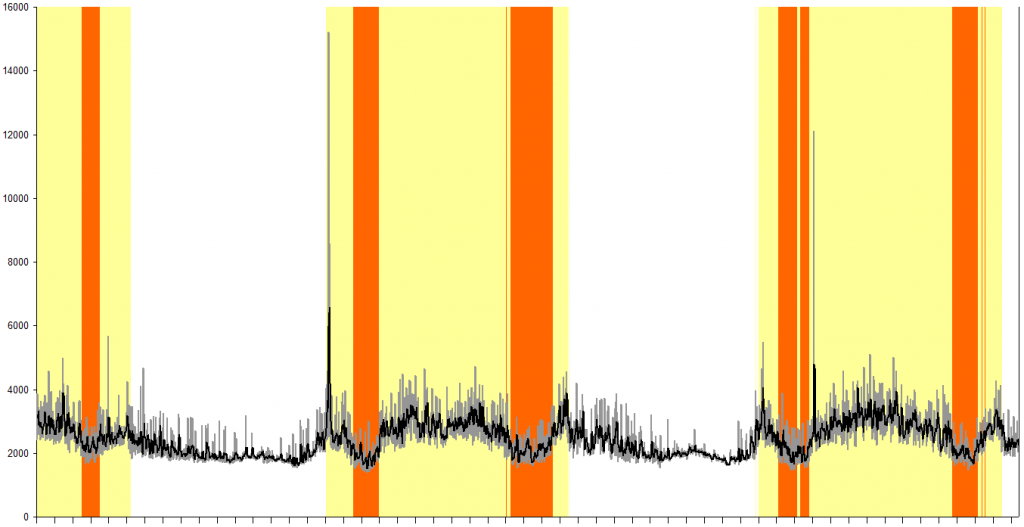
This plot starts at 14:00 on the 12th, and runs through until 20:25 today. The x axis ticks are every hour, and the y axis is response time in milliseconds as before. Clearly, the poor routing server is so badly overworked and/or underpowered that, even asking for just a single route, it follows the now quite familiar pattern of cycling between periods of returning incomplete routes to periods where no routes are returned at all, only resuming normal operation during the late evening-overnight-early morning quiet time (for the UK and western Europe timezones at least - does this mean there are different routing servers allocated to world.waze.com users depending on whereabouts in the world they are?).
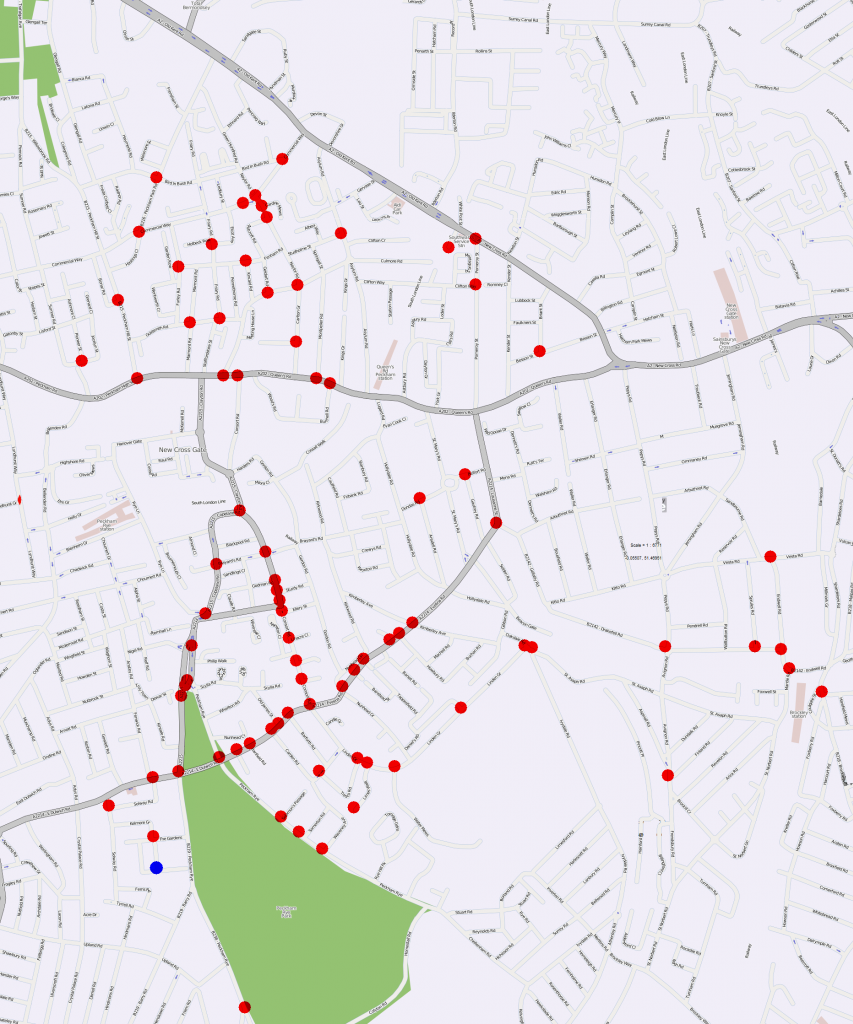
Endpoint plot is also familiar…
Raw data captured during this test: http://chizzum.com/lmr/test2.zip
Hi,
In order to recreate the problem, if you could have another test and share the following info with us:
- Starting and ending points.
- Time and date.
Thanks,
Shira
Shira, are the data in the zip file above not sufficient? See the csv files in particular.
No, because of the date, we need to have up to date info.
Thanks,
Shira
Ok, does that mean you think you might have fixed it? Or is that hoping too much? ![]()
Hoping too much ![]()
In order to check the problem we need to have up to date info.
But I hope after you will send us the info, we will fix the problem,
Thanks,
Shira
That will do! Thanks.
Unless you’d prefer a different route, then for consistency and comparison I’ll start logging again tonight using the same start/end points as the previous tests.
Will 24 hours of data be sufficient or would you like it to run for longer? And do you need the raw data or just the csv summary?
Hi,
If you could please use the following route request:
http://world.waze.com/RoutingManager/routingRequest?from=x%3A-0.156668998+y%3A51.65501626+bd%3Atrue&to=x%3A-0.06766258+y%3A51.45954977+bd%3Atrue&returnJSON=true&returnGeometries=true&returnInstructions=true&timeout=60000&nPaths=2
We need the time and date, when you got the error message.
Thanks,
Shira
Logging was started at around 10pm last night. Monitoring the live output whilst having breakfast this morning (around 7am) I noticed a few requests that were returning only a single route or none at all, so in that respect the routing server appears to be behaving as per the previous tests, and this test should be able to supply the data that Shira and her team requires.
Slightly worrying though is that for all of the requests I observed (even during setting up the test last night) where both routes were returned, the quickest route never quite made it to the requested endpoint. Whilst this is expected behaviour in busy periods, 10pm on a Sunday evening isn’t what previous testing would indicate to be a busy period - when I get a chance to examine the full logs in detail tonight it’ll be interesting to see if any requests returned the correct endpoints for both routes…
Excellent work, Twister. If needed, for comparison or whatever, I know of another route that fails similarly.
With almost 2 full days of data captured, logging has now stopped and a summary of the results is as follows:
Day 1 (9th September):
At 01:44 and 01:46 the returned routes flipped around, with the shortest route returned as the first result rather than the second.
The shortest route failed to reach the expected endpoint between 06:17-06:49.
Between 06:50-07:00 only a single route was returned.
Routing failed completely between 07:01-07:24, and again between 17:04-17:31
The quickest route never reached the expected endpoint, although in most of the results it was very close (51.4595492,-0.067670527 vs the expected 51.45954977,-0.06766258).
Day 2 (10th September):
The shortest route failed to reach the expected endpoint between 06:03-06:42.
Routing failed completely between 07:47-09:05, and again between 16:33-18:35.
The quickest route reached the expected endpoint between 02:57-06:19 and from 19:24 to the end of logging at 22:08.
Raw data for this test: http://chizzum.com/lmr/test3.zip
[i]Notes on the CSV file layout…
The first 4 columns contain data common to all routes returned in the request:
Columns 1&2 - Date/time of request
Column 3 - Elapsed time (ms) between submitting request and receiving response
Column 4 - 0 if any routes were returned, 1 if no routes were returned
Each returned route then adds 5 columns as follows:
Column 5 - 0 if route reached the exact expected endpoint, 1 if it did not (no matter how close it got)
Columns 6&7 - actual endpoint coordinates
Column 8 - route distance
Column 9 - route time[/i]
Shira - any update on how the devs are using these data?
Chris - I’ve not heard anything from Waze HQ on this but if it’s possible can you rerun? Just in case anything has changed in the last month since you did this. I understand if not given other priorities.
Thanks
David
I’ll have to check and see if the route tester still works after the Livemap changes, but yeah, should be able to do another run next week.
That would be excellent. At the very least we’d be ready if they want some more data.
You’ll probably want: /row-RoutingManager/routingRequest - arguments are as they were before I believe.
:ugeek:
Slight change in the request arguments, plus enforced use of a https request which meant having to set up SSL support in Indy… With that now working OK, a quick check of the revised code shows that it’s able once again to retrieve the test route used previously - I’ll leave it running overnight to make sure it’s stable on an extended run, and then fingers crossed we should be good to go next week.
Using the same routing parameters as before, another 2-day test was run earlier this week. Comparison with the results from the previous test suggests a whole load of absolutely nothing has been done to improve routing server behaviour…
Day 1 (21st October):
Between 06:04 and 06:39 the returned routes flipped around, with the shortest route returned as the first result rather than the second.
The shortest route failed to reach the expected endpoint between 06:04-06:51.
Between 06:40-06:51 only a single route was returned.
Routing failed completely between 06:52-07:49, and again between 17:17-17:23 and 17:25-17:33 (the server managed to return both routes at 17:24)
The quickest route never reached the expected endpoint, although in most of the results it was very close (51.4595492,-0.067670527 vs the expected 51.45954977,-0.06766258).
Day 2 (22nd October):
IIntermittently between 05:53 and 06:44 the returned routes flipped around, with the shortest route returned as the first result rather than the second.
The shortest route failed to reach the expected endpoint between 06:09-06:10, 06:12-06:18, 06:20-06:21, 06:24-06:37, and 06:41-06:44.
Routing failed completely between 07:33-08:50, and again between 16:36-18:37.
Between 01:57-02:02, no responses were received from the server.
The quickest route consistently reached the expected endpoint between 03:08-06:23 (with intermittent complete routes returned between 02:29-03:05 and 06:34-06:36), at 11:54, 12:59-13:00 and 13:06, and then from 19:24 until 23:59 where logging ended.
Raw data for this test: http://chizzum.com/lmr/test4.zip
[i]Notes on the CSV file layout…
The first 4 columns contain data common to all routes returned in the request:
Columns 1&2 - Date/time of request
Column 3 - Elapsed time (ms) between submitting request and receiving response
Column 4 - 0 if any routes were returned, 1 if no routes were returned
Each returned route then adds 5 columns as follows:
Column 5 - 0 if route reached the exact expected endpoint, 1 if it did not (no matter how close it got)
Columns 6&7 - actual endpoint coordinates
Column 8 - route distance
Column 9 - route time[/i]