Здравейте,
Знаете ли кога ще бъдат интегрирани нотификации за камерите за средна скорост както и предупреждения за тях?
Поздрави!
UP
Вижте тук:
According to the article:
Here is exactly where the first average speed sections are on the “Trakia” motorway:
- 19-kilometer section between Vakarel and Ihtiman
- 23-kilometer section from the Kostenets turnoff to the Muhovo turnoff (includes “Trayanovi Vrata” tunnel)
- 9-kilometer section from the Kostenets turnoff to “Trayanovi Vrata” tunnel
- 10-kilometer section from the Velingrad turnoff to the Kalugerovo turnoff
- 22-kilometer section from the Pazardzhik interchange to the Tsalapitsa interchange
- 28-kilometer section from the Pazardzhik interchange to the Plovdiv West interchange
**- 35-kilometer section from the Pazardzhik interchange to the Plov
This is not about where they are, but how long the sections are. Here is exactly where they are:
| Road | Starting point | Ending point | Map (image) |
|---|---|---|---|
| Trakia Motorway | Vakarel (km 24+288) | Ihtiman (km 43+448) | See the section here |
| Trakia Motorway | Ihtiman (km 43+448) | Vakarel (km 24+288) | See the section here |
| Trakia Motorway | Tsalapitsa (km 107+663) | Radinovo (km 118+599) | See the section here |
| Trakia Motorway | Radinovo (km 118+599) | Tsalapitsa (km 107+663) | See the section here |
| Hemus Motorway | Belokopitovo (km 340+293) | Kaspichan (km 361+581) | See the section here |
| Hemus Motorway | Kaspichan (km 361+581) | Belokopitovo (km 340+293) | See the section here |
| Hemus Motorway | Devnya (km 399+703) | Ignatievo (km 418+126) | See the section here |
| Hemus Motorway | Ignatievo (km 418+126) | Devnya (km 399+703) | See the section here |
| Struma Motorway | Sandanski (km 143+945) | Damyanitsa (km 151+251) | See the section here |
| Struma Motorway | Damyanitsa (km 151+251) | Sandanski (km 143+945) | See the section here |
| Struma Motorway | Balgarchevo (km 90+219) | Pokrovnik (km 92+548) | See the section here |
| Struma Motorway | Pokrovnik (km 92+548) | Balgarchevo (km 90+219) | See the section here |
| Northern Speed Tangent | between 18 and Iliyantsi Junction (km 50+427) | Chepintsi (km 60+705) | See the section here |
| Northern Speed Tangent | Chepintsi (km 60+705) | between 18 and Iliyantsi Junction (km 50+427) | See the section here |
| I-1 | Slatino (km 343+292) | Kocherinovo (km 353+878) | See the section here |
| I-1 | Kocherinovo (km 353+878) | Slatino (km 343+292) | See the section here |
| I-2 | Struyno (km 104+733) | Shumen (km 112+381) | See the section here |
| I-2 | Shumen (km 112+381) | Struyno (km 104+733) | See the section here |
| I-3 | Dolni Dabnik (km 100+471) | Telish (km 122+349) | See the section here |
| I-3 | Telish (km 122+349) | Dolni Dabnik (km 100+471) | See the section here |
| I-4 | Balgarski Izvor (km 13+536) | Sopot (km 22+734) | See the section here |
| I-4 | Sopot (km 22+734) | Balgarski Izvor (km 13+536) | See the section here |
Hello, as has become clear, starting today (07.09.2025) the average speed law comes into force. Please let us know if anything is needed to achieve a faster integration for average speed tracking in Waze — Bulgaria. As far as I can see, the app already has this functionality in other countries (Manage average speed enforcement zone alerts - Waze Help); the question is, what is needed to integrate it in Bulgaria and, accordingly, if there is anything we can help with to speed up the process. For example, helping with marking the segments, etc. Regards!
Another thing I don’t see mentioned anywhere is what the average speed for the specific section actually is.
For example: on the “Northern Speed Tangent” between the two points, there are no other speed limits besides 120 km/h, which implies that the average speed there is 120 km/h. But if we look at I-4 Balgarski Izvor – Sopot, there you have intersections with a 60 km/h limit and out-of-town roads with a 90 km/h limit, which results in an average speed of, let’s say, 67.5 km/h for the section (this is just an example/assumption; I have no idea what the average speed value should be).
Hello, you have a misconception about average speed. Average speed is calculated based on speed limit/distance/time; you’re probably wondering what the maximum average speed is for the sections in question. In addition to the speed limits you mentioned (60/90/120 km/h), you must include the length of the sections (5.4 km / 3.2 km / 19 km) with their respective maximum limits (5.4 km stretch with a 60 limit / 3.2 km stretch with a 90 limit / 19 km stretch with a 90 limit) and, most importantly, the minimum time it takes to travel from camera to camera.
To put it simply: Imagine a road that is 100 kilometers long with a speed limit of 100 km/h. This section is covered at its fastest in exactly 60 minutes. If you cover it in 30 minutes, then you were traveling at a speed of 200 km/h. Average speed is calculated on the same principle, but my example is for a single section, whereas average speed is usually based on several sections.
For us as drivers, the average speed for these sections doesn’t really matter as much as the time it takes us to pass through them. The average speed is calculated based on time and compared to the corresponding maximum allowed average speed for the specific section we’ve passed through. Regards!
Exactly @AntoanTsvetanov, my question is:
You have a 100 km stretch. For 50 km of the stretch, your limit is 90 km/h, and for the other 50 km, the limit is 100 km/h. Your average speed should be 95 km/h if you followed the limits.
Where in these links does it say either how much time it should take to get from point A to point B, or what the average speed between the two points should be (aka S=V*T — we have S, we need either V or T)?
Actually, that’s a very good question; this information hasn’t been published for some reason. Hypothetically, for the sake of transparency, we would have information about the time and maximum average speed for all segments, but alas, it’s not there. They probably haven’t been published because these parameters are dynamic and someone would have to edit them daily on the RIA (API) website, which for me isn’t an excuse, but that’s the situation.
Anyway, they’ve uploaded a certificate in which they’ve provided a sample file with a violation recorded specifically from the Northern Speed Tangent.
Link to Certificate for Approved Type of Measuring Instrument: (p. 9) https://www.bgtoll.bg/content/files/2025/08/25/14ea022e8931b6eb1379e6999fa23ba0.pdf
What is some of the information in the sample violation file?
Camera A coordinates - 42.719672 23.400498
Camera A time - 10:39:10.791
Camera B coordinates - 42.765369 23.296978
Camera B time - 10:44:11.999
Distance - 10,278 meters
Speed limit - 100 km/h
Speed above which a violation is recorded - 110 km/h
Recorded speed - 123 km/h
Link to the segment → https://www.waze.com/live-map/directions?to=ll.42.719672%2C23.400498&from=ll.42.765369%2C23.296978
In fact, there are data/formulas set somewhere that are not publicly available, but our speed is being measured based on them every second. Strange business.
A curious fact I decided to share after looking at this example:
Camera A time - 10:39:10.791
Camera B time - 10:44:11.999
The time between the two photos is 301.208 seconds.
We divide it by the hour (301.208 / 3600 = 0.0836688888888889)
We divide the distance by the time (10278 / 0.0836688888888889)
We get an average speed = 122.841
The recorded violation in the certificate is 123 km/h.
I don’t support speeding, but de facto if you drive at an average speed of 110.841 km/h, will it be rounded to 111 km/h and will you get a speeding ticket? What if it’s 110.001 km/h, is it still considered 111 km/h?
The other thing I noticed is that, according to them, the limit is 100 km/h.. Since I often pass through there and know this section, there are limit signs only in bad weather! Otherwise, the entire section is 120 km/h, which should mean that the average speed should also be 120 km/h. and the example should only be a 3 km/h excess.
Then the question remains, how will they “take into account” this type of restriction (bad weather, snow, rain)?
Strange 
Something else that’s interesting.
I took another look at the same “type approval certificate No. 25.06.52237”:
- The files were modified/created at 7:45 AM.
- The violation from “one of the attached files” is at 10:44 AM.
Meaning someone manually created the violation 3 hours earlier, or it’s unclear how well the clock is synchronized? If the clock isn’t synchronized somewhere, what time are the tickets based on? And right now I’m only looking at these two pages; I can’t imagine if I looked at the whole file.
It’s not strange, it depends on the type of vehicle — 120 for passenger cars, but for trucks and buses there are different limits, just as there are on the motorways.
It looks like a passenger car, but it might have been listed as a commercial vehicle by some company and registered that way with the Traffic Police (KAT).
The example is good, but the result is not correct at all; the average speed is 94.736…
It would be more illustrative if it were 10 instead of 90: then you cover 50 km in 0.5 h and 50 km in 5 h.
Or you’ve covered 100 km in 5.5 h, which means an average speed of 18.18 km/h — quite different from the arithmetic mean of 55.
Actually, the category information is in the certificate, along with photos of the vehicle. The vehicle is registered under category M1 N1 and operates under the same restrictions as other passenger cars. In this case, the Speed Tangent is considered an expressway and the limit is up to 120 km/h. In the second photo in the certificate, you can see that the vehicle is this one (which I attached below); I just don’t understand why they hid its registration number from the photos, given that it’s written in the text file a bit further up.
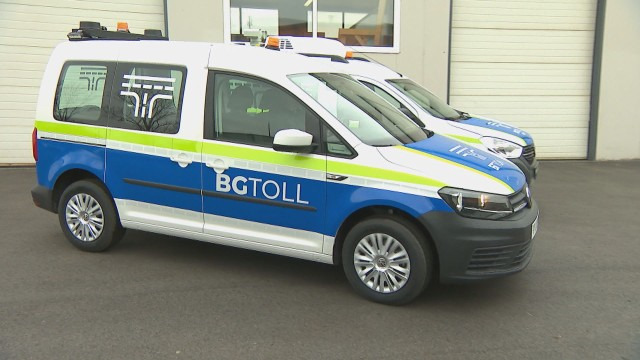
In an interview, the minister said that for average speed, the highest speed in the section would be taken into account.
Hello friend, let me take a moment to share as well.
The times might seem confusing to you because the cameras record in UTC, a universal time which is 3 hours behind; it says so right here:

And then the Ministry of Interior (МВР) converts it to Bulgarian time, I assume, which becomes 10:44… or whatever it’s supposed to be.
Have a nice day!
Hi, thanks for the clarification! I didn’t spend much time on the certificate; I was mainly looking around pages 8–9 and consequently missed the UTC. This solves the mystery behind this question. I’m glad you took the time to read it and, most of all, to write back about it. Thanks again.
Have a great day!
You can submit a request here to measure average speed — the more we vote, the higher the chance they’ll implement it: Show average speed when in an average speed zone – Waze Suggestion Box